Example Questions
A list of example questions we can walk through to show you how to gain insights to your data easily.
Sum Of Attendance Hours Over Time
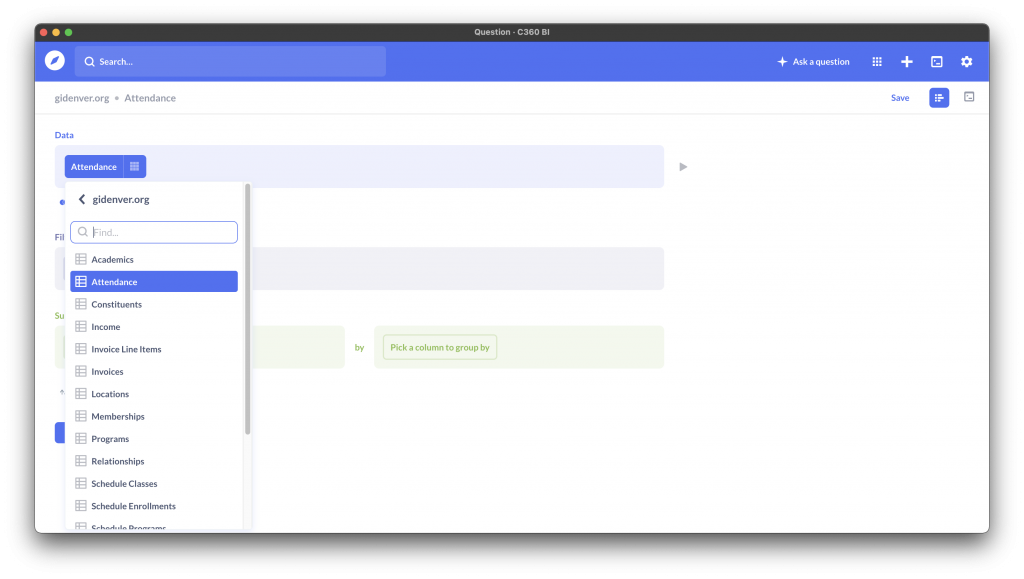
From a custom question, select the domain folder, and select the attendance table.
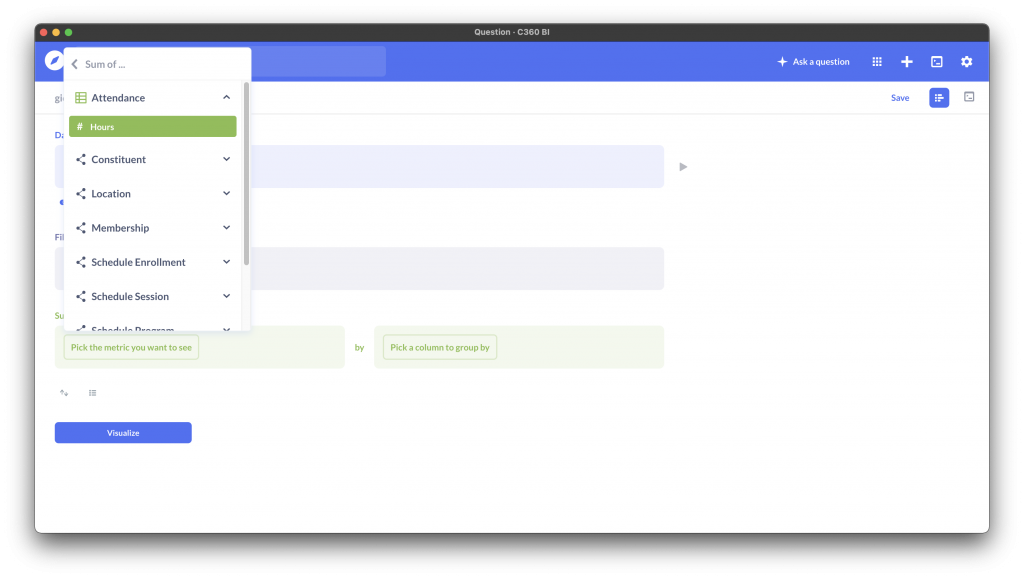
Add a summary to sum() the hours column.
Now for a date range, you can either apply a filter here, or save this question and apply a filter from the dashboard. I’ll save the filter for the dashboard, which makes this a little more robust.
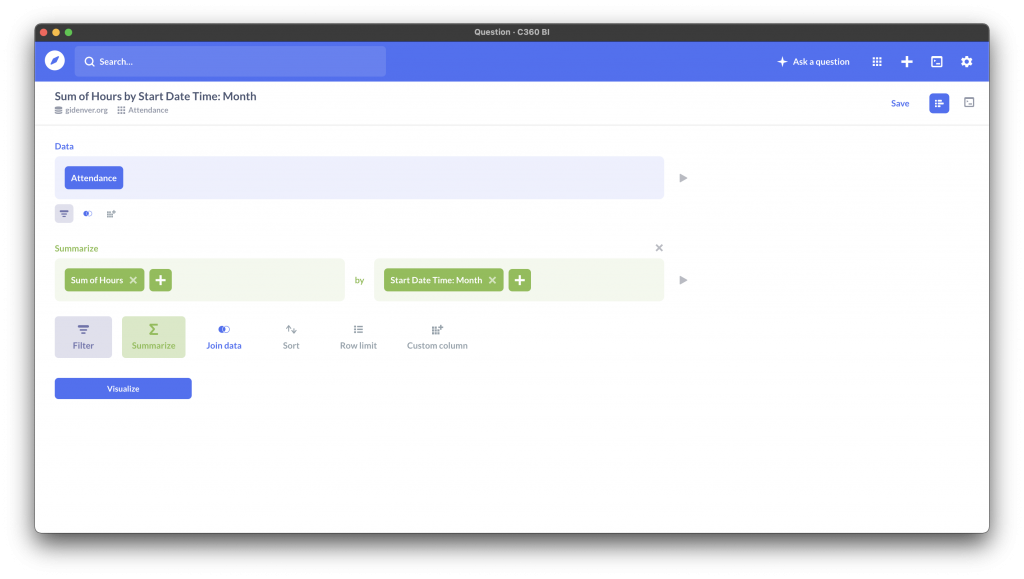
Next add a summary to group by the start date. Dates allow us to bin by a value, in this case, let’s select month.
Here is the complete question.
Next and last, click visualize data. You’ll see by default, C360 BI is smart enough to realize you have a number and date field, so it presents your data on a line chart. This chart represents your total attendance hours over time.
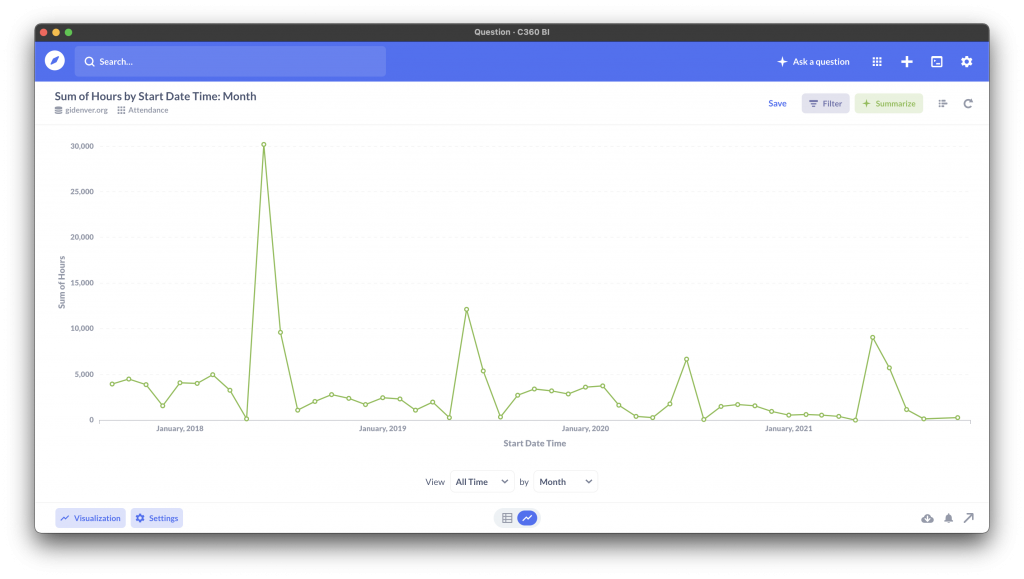
You could easily apply a filter to only show the previous 30 days attendance, save this question, and throw it up on a dashboard.