Questions
Questions are where we start with everything. Questions come in two varieties, Simple and Custom. An example of a question could be, “show me constituents who live in zip code 98501”. A question can start with a data table (raw data), such as constituents, or with another question such as a Core Question.
Questions can be visualized in various formats, the most common being a table or list. Use the visualization that best suits your questions result. For example, if a question returns a single number, the number visualization is probably best.
Core Questions
Core questions provided by the Compass-360 team can be a great starting point to create your own question. You can modify the existing question logic and save a new version of that question in your organization’s collection. You won’t be able to overwrite the existing question.
Our team will manage these questions and make periodic updates to them over time. We’ll also be adding new questions as we discover common ways to look at data.
Core questions are broken out into sub-collections within the top level questions collection. These are grouped by the type of data they represent for easy navigation.
Here is a reference to the Core Questions.
Create A Question
The first step to creating a question is to think about what action the results will provide. This allows you to visualize the data you want to be returned and what filters you will need to apply. It also helps to design the question display, such as a number or bar chart.
Now that we know what data we want to return and how, let’s start with the data source. It can either be an existing question, or a raw data source.
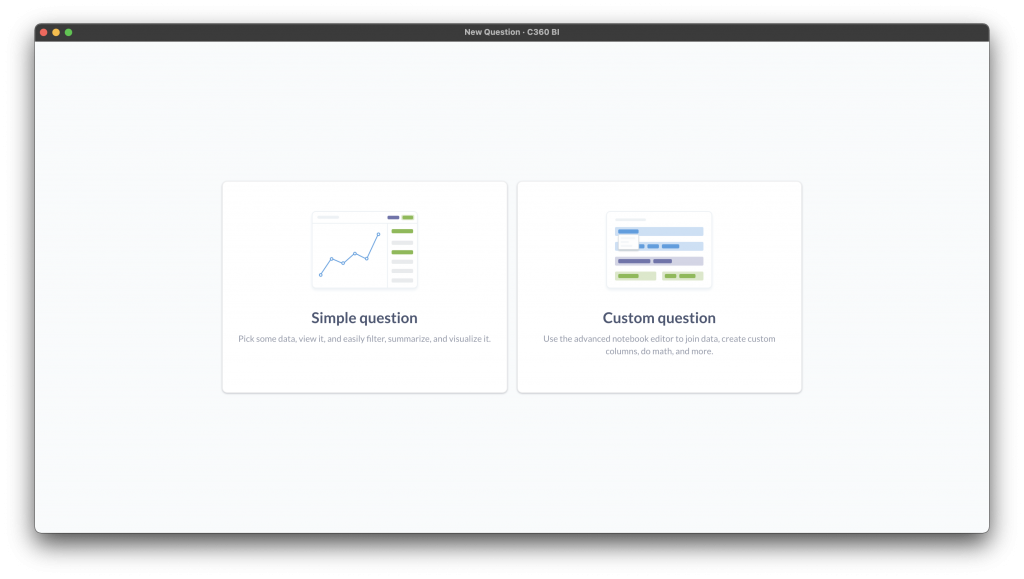
Navigate to the Reporting module from the menu. One the page is loaded, click on the New Question button.
Choose what type of question you want to start with, simple or custom. Don’t worry about selecting the correct one, you can modify the question from both options. The difference is a simple one brings your right to the visual editor, while a custom one shows the question editor first.
Simple Question
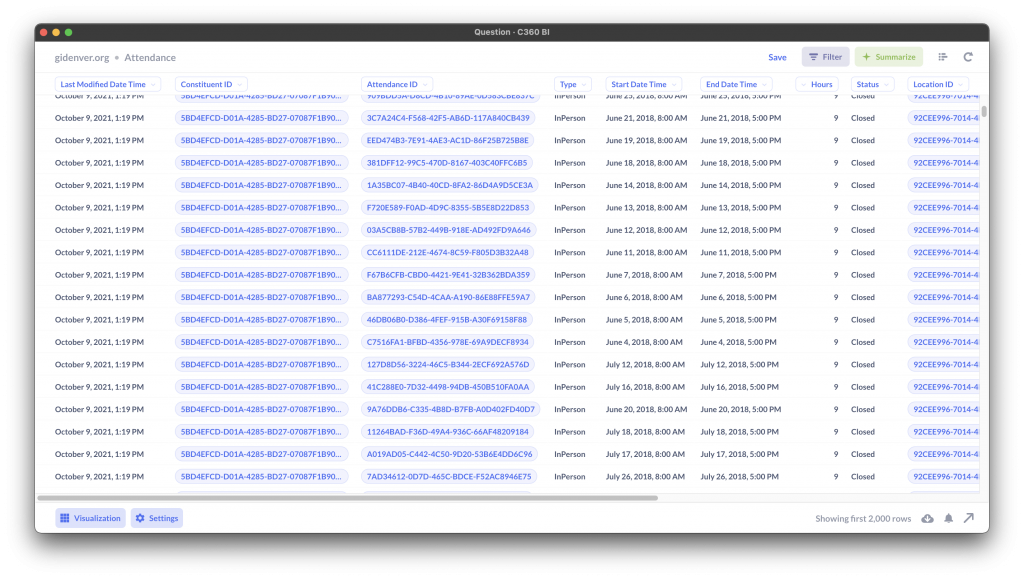
Select the data source you want to start with. Raw data (tables) will be within your domain collection. For example, anonymously-yours.org. You can also choose a saved question. Once you select your source, you’ll be brought to the visual editor. In most cases, you’ll be brought to a table showing you the first 2000 rows of data.
Custom Question
Select the data source you want to start with. Raw data (tables) will be within your domain collection. For example, anonymously-yours.org. You can also choose a saved question. Once you select your source, you can continue within the question editor to join in data, add filters, summarize, sort and more. When you’re ready, click visualize to be taken to the visual editor.
Saving A Question
When you are satisfied with your question results, click the save button in the top right. You’ll be asked to name your question an optionally add a description. Descriptions are a good way to leave a message to the consumer of the question about the results of the question.
You’ll also be asked to save this question in a collection. Choose a location, that you have permissions to write to, that best suits the organization of your collections.
After you save a question, C360 BI will ask you if you want to add this question to a dashboard. You can also create a new dashboard on the spot. Once you do, you’ll be taken to the dashboard with the question already populated.
Question Tips
Schedule Design
Due to the nature in the flexibility that we allow when designing your schedule, some schedule data is dynamic and not always clear. For example, not all programs have a parent of a session. Not all sessions have a parent of enrollment.
When looking up constituents based on a level within a schedule, it’s best practice to start at the lowest level – classes.
Question Features
A question has various components to it, such as filters, summarizing, joining data, sorting and more.
Question Editor
The question editor allows your to build your question, step-by-step, in a linear and logical fashion.
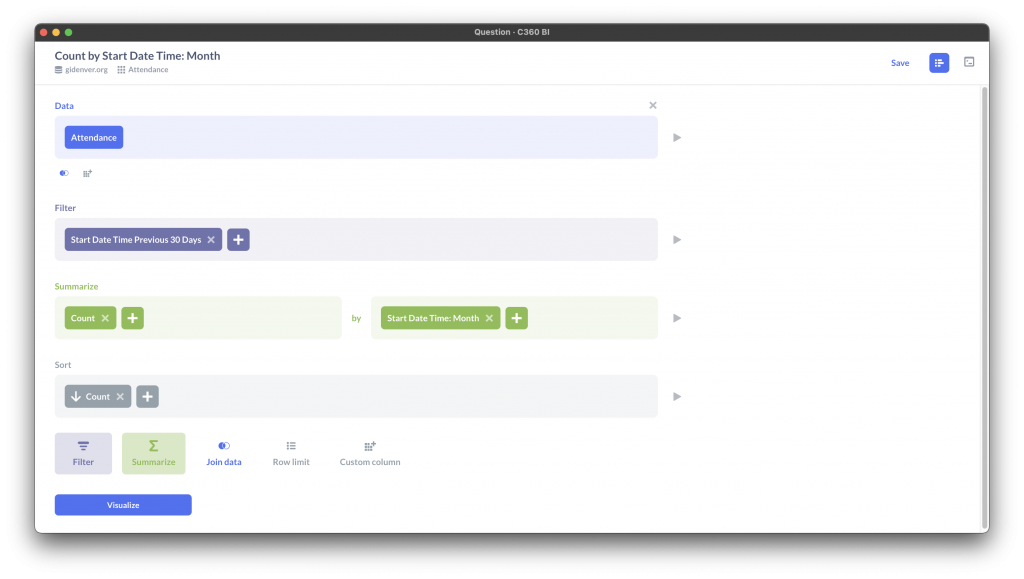
At every step, you can preview the results to validate you’re getting the right data by clicking on the play button next to the section step.
Visual Editor
The visual editor allows you to do the same features as the question editor view, but in a different fashion. It also allows you to visualize the data you are working with in various formats. You can always access the question editor from the button in the top right next to the refresh icon.
Automatic Data Awareness
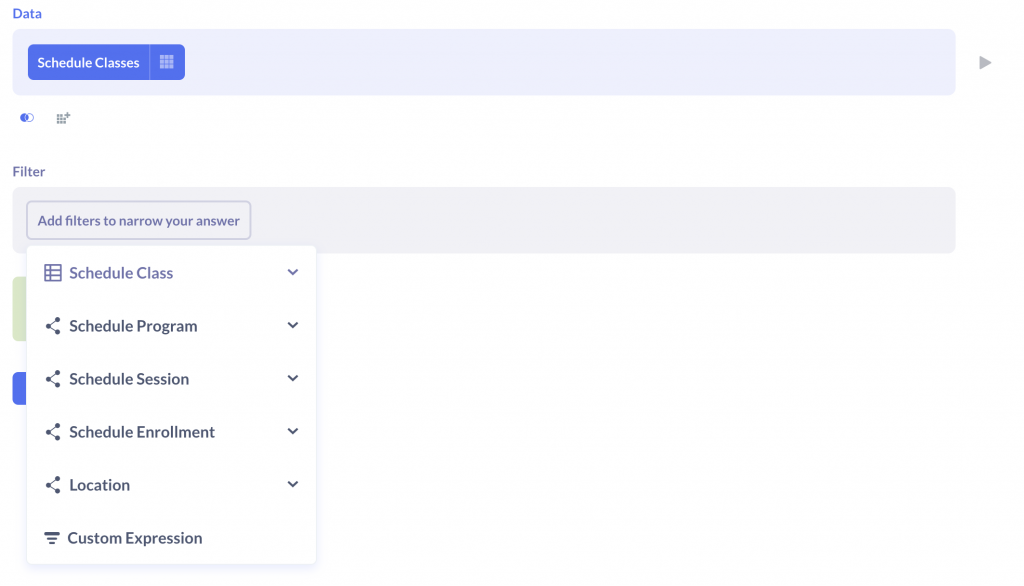
When filtering and sorting data, it’s fairly common to want to preform a filter on a table that is related to the source. For example, locations for a class or constituents on a roster. We have defined these relationships for you, which allows you to do this automagically without having to join the data in prior. For example, here we have selected the Schedule Classes data source. By opening the filter step, we can see other data sources, linked to this class, defined by the foreign key icon.
Filtering Data
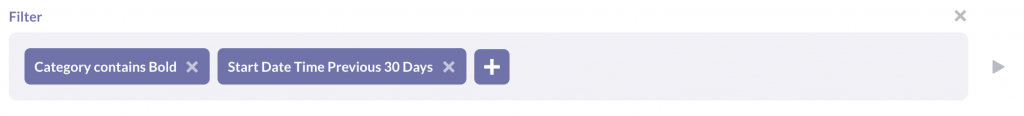
From the question editor, click on the filter step. A filterable list of columns from the resulting data will be selectable. You can then choose what type of you filter you want. These filter types change depending on the type of data. For example a date column will show date filter types, a number column will show number types.
From the visual editor, you can access these same features from the Filter button in the top right of the window.
C360 BI has defined the relationship between various tables for you. This is a powerful feature that automagically lets you filter, summarize and sort on data from related tables, without having to join that tables data in.
Summarizing Data
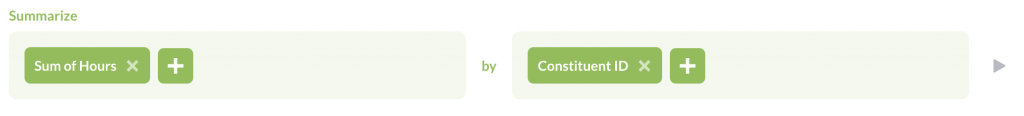
This let’s you create a column based on a function. You can choose a predefined function or craft your own. Custom functions have descriptions on how to use them. They mirror common Excel functions. The existing functions are fairly straightforward, such as count(), sum() or average(). Depending on the resulting data, some functions may not be available. For example, sum() is only available when there is a number field returned.
You can also group your data on a single field. A common example of this is returning unduplicated results based on a constituent ID. You can group the results by a constituent ID, returning only rows for every unique constituent. Keep in mind, when grouping results, inherently only the columns you have grouped by are returned. You can group results by multiple columns. If you need to group, but want to retain data, you can then further join in the data you need after your group.
You can access the summary functions from the visual editor from the top right of the screen. From the question editor, there is a summarize step. Multiple summarize steps can be used in a single question.
Joins
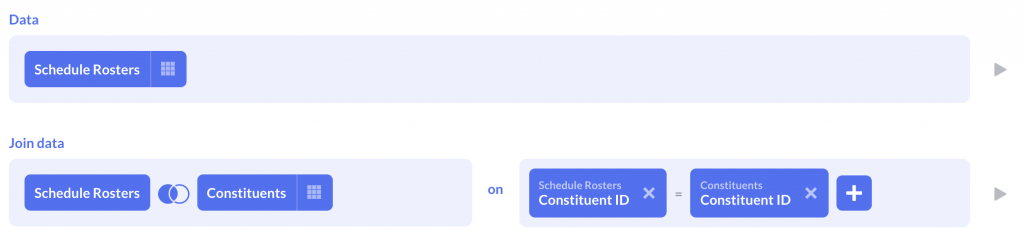
Some questions may require you to join in data from another table. You may not ever need to use this function, but if you find your self not getting the data you want returned, you probably need to join in data. A great example of this is the Class Rosters data source.
The Class Rosters table is a basic table with a constituent ID column. It does not store the participants data such as their first name. That information is saved in the Constituents table. If we want to return data about the participant on the roster, we need to join in the Constituents table, using the constituent ID in the roster table.
You can read a short doc on how joins work and the different type of joins here. If you have any questions or need help, don’t hesitate to reach out.
Read the data definitions doc and browse your data to discover the various primary and foreign keys that exist. Most of the time, C360 BI is smart enough so that when you select a table to join in, the columns to join on will be automatically selected.
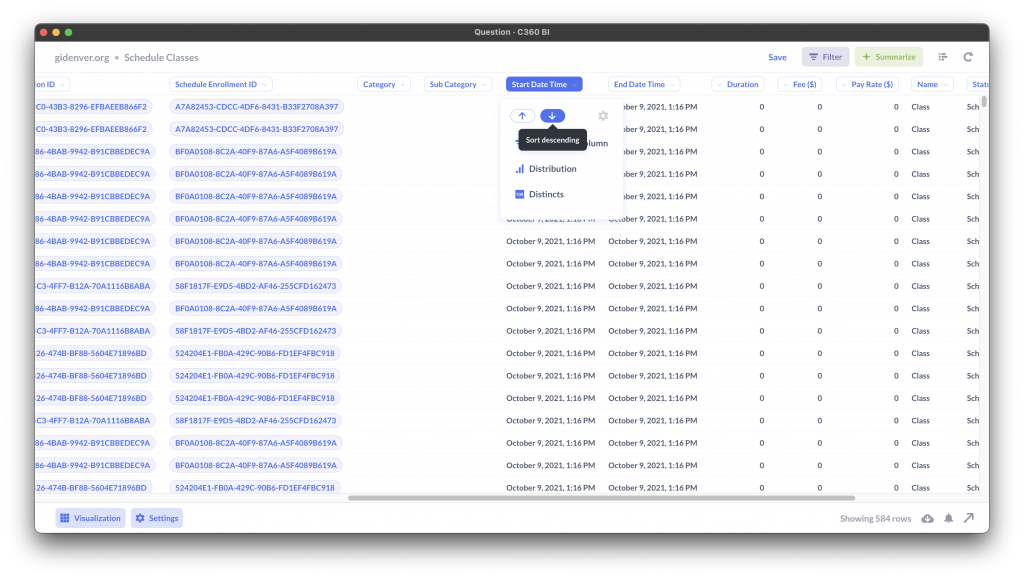
Sorting
From the question editor, you can set the sort for the results. You can only sort by columns that are present in the resulting data source. From the visual editor, simply click on the column you want to sort. You can preform other options on that column from the menu dialog that opens.
Visualization Options
There are several ways to visualize your data. Depending on the results, C360 BI will show you the options you can choose.
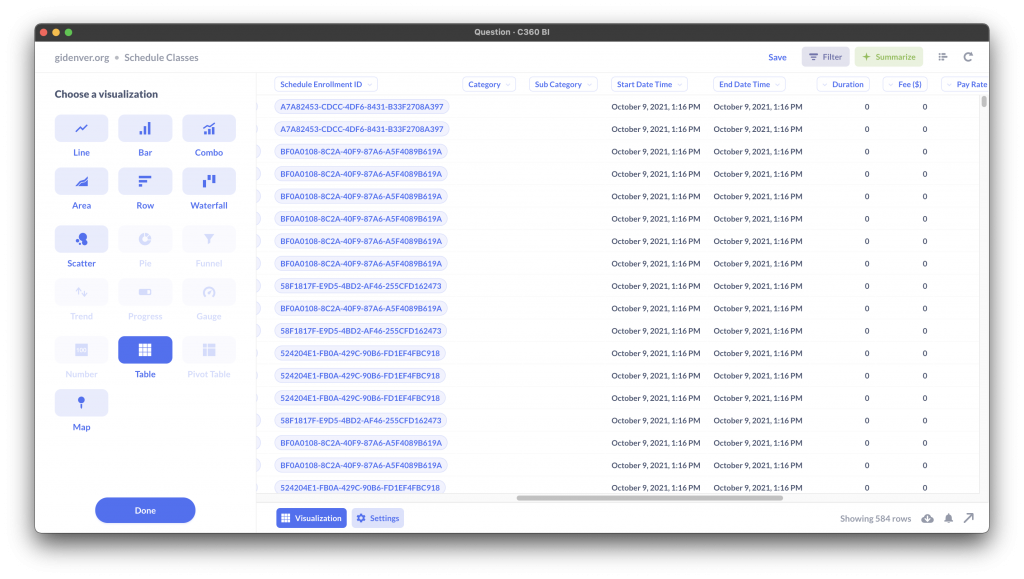
Visualization Settings
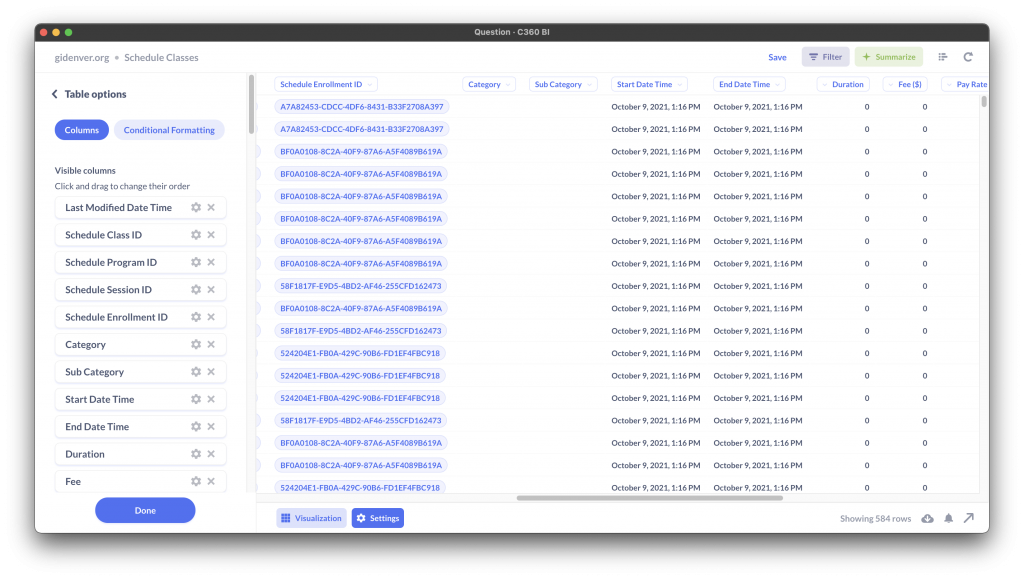
When viewing the results in the visual editor, you can modify a columns display name, order and visibility. Click on a column and then click on the gear icon in that menu. You can also access these by clicking on the Settings button in the bottom left of the visual editor.
Depending on the type of visualization, different options will be displayed. For example, below we have a table, so the options are to manage the columns displayed. If the visualization was a number, the number settings will be displayed.
Foreign Key Links
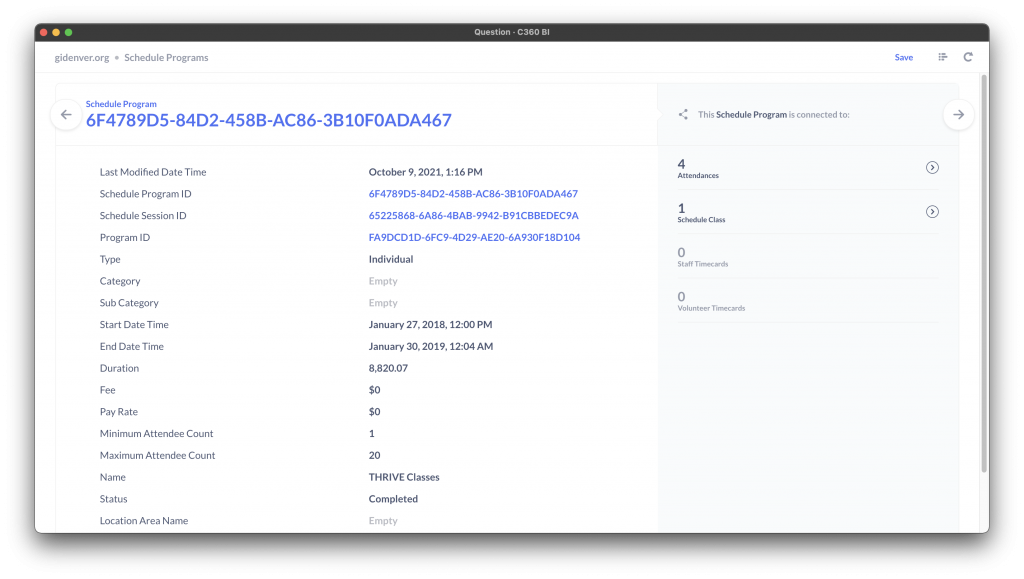
If you’ve been playing around with C360 BI, you’ve probably noticed a lot of ID columns. These ID columns are import as they provide us with the ability to link data from other tables. You’ll see these columns display in blue as a link. You can click on one of these cells to preform actions on that data such as filter, or view records related to that ID. It’s a powerful and simple way to discover more about your data.
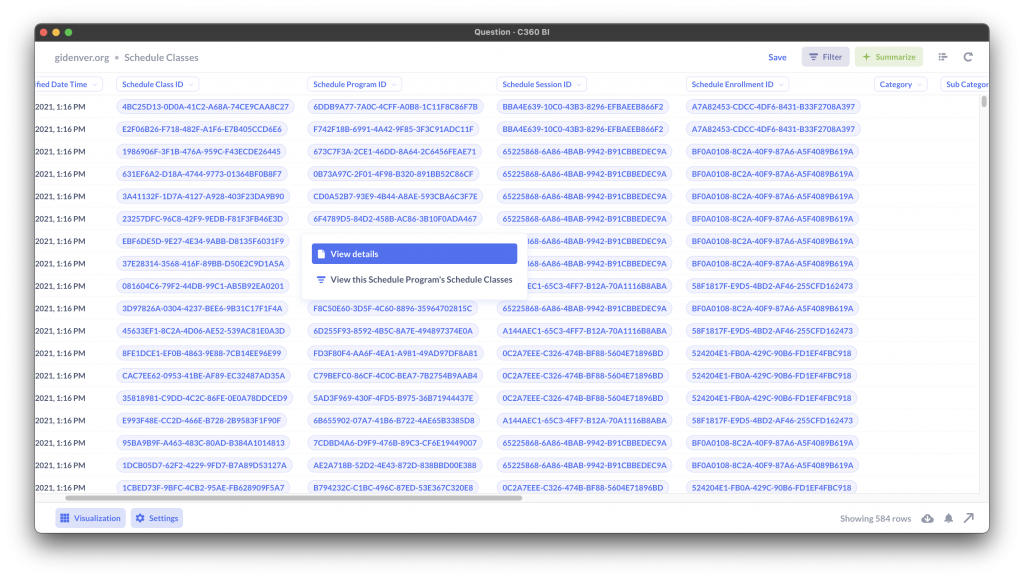
When viewing the details, you can also view other tables related to this record, such as the attendance related to a program, or other classes that use this program. Click on any of the items in the “connected to” sidebar on the right.
Download Results, Alerts and Sharing
From the visualization editor, there is a download icon on the bottom right of the screen. Click to download the results.
From the menu, you can also share your question. Depending on your needs, you could create a public link to share with people outside of your organization.
Alerts can send you this question to your inbox when certain criteria is met. This is a powerful feature that can notify you when something is going on, for example, when your expiring membership count hits a certain number.
Core Questions
Below is a list of all the core questions with a short description. Attendance Sum of Duplicated Attendance Hours Total sum of attendance hours. Includes both program...
Example Questions
A list of example questions we can walk through to show you how to gain insights to your data easily. Sum Of Attendance Hours Over Time From...